Let's make Wardley maps in VSCode
Wardley Maps
Somewhere in 2016 I stumbled upon a conference video presented by a person named Simon Wardley ( @swardley ) hence the name Wardley mapping. He was telling the story of “crossing the river by feeling the stones” and it was fascinating to witness how this method of creating maps communicated so much understanding. That is even without fully understanding the capabilities you unlock with them.
Origins
The reason I bumped into the video is because I’ve been looking into the “OODA loop” famously formulated by John Boyd. In the world of DevOps this is also one of the ways we can iterate, learn and take deliberate action. Wardley mapping includes this concept but mixes it with a few other things, among which Sun Tzu “The art of War” in what I can only describe as great insight by Simon who fused this coherently together.
The idea is that a map combined with what Simon calls doctrine (say “wisdom gathered through the ages”) allows for better strategic game play. The simplest form is to decide, what to “Buy or Build”, but more refined is already what type of engineering to use if decided to build something. Besides that one can also gain insight in where for example competitors might spend energy or develop new “higher order” services to disrupt markets.
Maps
The basic idea of a map is that it gives you more information that things you would see in a spreadsheet, a table or a graph for that matter. What is added is “position”, “movement” and “direction”, introducing a context in which the information is residing and making that easier to understand. That is also what makes maps so powerful and why they require so little explanation. People seem to intuitively understand the information presented.
The right time
Back in 2016 I loved the concept but was not in a position to put maps to good use (I didn’t know how or where to begin). But late 2021 my eye caught a twitter post by Ben (Ben at Hired Thought) in which he announced a free workshop to dive into starting with mapping. I really appreciated that workshop since it opened my eyes and made me look into the Wardley mapping landscape to see what’s changed.
The tools are here
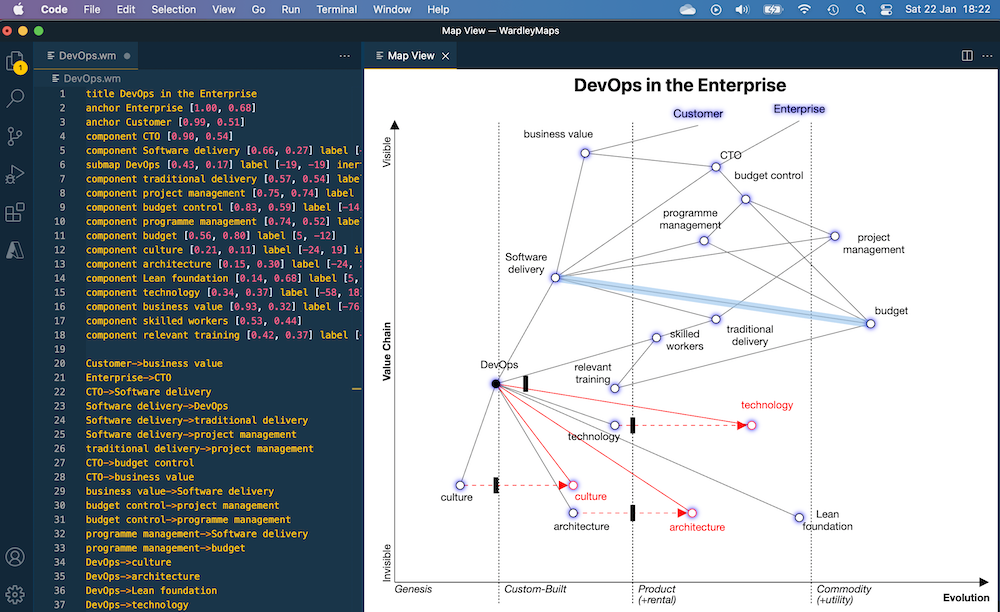
What is one of the greatest improvements is that there are now dedicated tools to make maps, which helps tremendously in the speed at which you can create a map. There is https://onlinewardleymaps.com/ so you can use your browser to create maps. Personally I like the “offline” version better. You can install that same tool into VSCode by installing the Wardley Map extension

First steps
When taking the first steps with the VSCode extension, open a folder, create a new file there with a .wm extension. Then for example ste the “title” keyword and a description. Render the map by running the command “Wardley Maps: Display Map” (ctrl+shift+p search Wardley or on mac cmd+shift+p). This will render a live view of the map you are drawing. Add your first point by adding the “component” keyword followed by a description. pick up the point and move it to the desired place on the canvas by dragging it with the mouse. Repeat and add connections, it’s fairly straight forward. Sometimes moving a point doesn’t go as smooth as you may like, usually that happens if you try to nudge it onto an area where the label already resides. You’ll get the hang of this sooner than later. See full list of capabilities below.
Usage:

To set the title
Example:
title My Wardley Map

------------------------
To create a component
component Name [Visibility (Y Axis), Maturity (X Axis)]
Example:
component Customer [0.9, 0.5]
component Cup of Tea [0.9, 0.5]

------------------------
To create a market
market Name [Visibility (Y Axis), Maturity (X Axis)]
Example:
market Customer [0.9, 0.5]
market Cup of Tea [0.9, 0.5]
evolve Customer 0.9 (market)

------------------------
Inertia - component likely to face resistance to change.
component Name [Visibility (Y Axis), Maturity (X Axis)] inertia
Example:
component Customer [0.95, 0.5] inertia
component Cup of Tea [0.9, 0.5] inertia
market Cup of Tea [0.9, 0.5] inertia

------------------------
To evolve a component
evole Name (X Axis)
Example:
evolve Customer 0.8
evolve Cup of Tea evolve 0.8

------------------------
To link components
Example:
Start Component->End Component
Customer->Cup of Tea

------------------------
To indicate flow
Example:
Start Component+<>End Component
Customer+<>Cup of Tea

------------------------
To set component as pipeline:
pipeline Component Name [X Axis (start), X Axis (end)]
Example:
pipeline Customer [0.15, 0.9]
pipeline Customer

------------------------
To indicate flow - past components only
Example:
Start Component+<End Component
Hot Water+<Kettle

------------------------
To indicate flow - future components only
Example:
Start Component+>End Component
Hot Water+>Kettle

------------------------
To indicate flow - with label
Example:
Start Component+'insert text'>End Component
Hot Water+'$0.10'>Kettle

------------------------
Pioneers, Settlers, Townplanners area
Add areas indicating which type of working approach supports component development
Example:
pioneers [<visibility>, <maturity>, <visibility2>, <maturity2>]
settlers [0.59, 0.43, 0.49, 0.63]
townplanners [0.31, 0.74, 0.15, 0.95]

------------------------
Build, buy, outsource components
Highlight a component with a build, buy, or outsource method of execution
Example:
build <component>
buy <component>
outsource <component>
component Customer [0.9, 0.2] (buy)
component Customer [0.9, 0.2] (build)
component Customer [0.9, 0.2] (outsource)
evolve Customer 0.9 (outsource)
evolve Customer 0.9 (buy)
evolve Customer 0.9 (build)

------------------------
Link submap to a component
Add a reference link to a submap. A component becomes a link to an other Wardley Map
Example:
submap Component [<visibility>, <maturity>] url(urlName)
url urlName [URL]
submap Website [0.83, 0.50] url(submapUrl)
url submapUrl [https://onlinewardleymaps.com/#clone:qu4VDDQryoZEnuw0ZZ]

------------------------
Stages of Evolution
Change the stages of evolution labels on the map
Example:
evolution First->Second->Third->Fourth
evolution Novel->Emerging->Good->Best

------------------------
Y-Axis Labels
Change the text of the y-axis labels
Example:
y-axis Label->Min->Max
y-axis Value Chain->Invisible->Visible

------------------------
Add notes
Add text to any part of the map
Example:
note Note Text [0.9, 0.5]
note +future development [0.9, 0.5]

------------------------
Available styles
Change the look and feel of a map
Example:
style wardley
style handwritten
style colour

------------------------
First results
I’ll tell more about specific maps I’ve made in other posts, but for now I can say: It really works to create better understanding of the landscape of the complex initiative’s I’m working on.