Teaching Wardley mapping, what I learned
A bit of Feynman to start
Over the course of a few years, well maybe a decade or so I came to appreciate the way to learn something is to teach it. As Feynman stated: “If you cannot explain something in simple terms, you don’t understand it”. With Wardley maps this seems to be the case as well. So to build up my understanding I had to immerse myself and dive deep into the subject matter, not just reading but doing. In parallel I have to seek reflection on my current understanding of it by explaining what I think I’ve learned and what may benefit others to get an understanding of where I’m at. With the feedback I’ve gotten so far I still feel like I’m somewhat a novice but I’m chipping away at improving.
Learning from the journey of others
We know that @swardely has built his knowledge and skill in relation to Wardley mapping over at least two decades. He’s documented it well and has made many appearances to tell his story and enlighten his journey into Wardley mapping. It would be impossible for me (maybe anyone) to fully appreciate the details and intricacies of how Simon approaches making and developing maps. Have a look at the vast amount of information Simon’s already documented.
That’s also not the key point for me to learn, I’m not trying to become Simon, I try to learn mapping by doing and to teach about mapping. If I want to teach this subject matter, I have to find my own story based on what’s there. As maps show, once something reaches a kind of maturity through evolution it creates opportunity to build higher order systems on top of that. That is how I see the opportunity to build my own story on top of this evolved body of knowledge. I love how this enables me to use my own fascination and curiosity for the subject matter to discover my own way of learning. I hope this sparks a few ideas with others I meet along the way and inspires people to start learning to use Wardley mapping themselves or tell others about it.
My starting point
The essentials seems like a good way to go about this, because well “they are essential” :-D. However, what is essentials to me is probably different than what is essential to you. To get going though, here’s how I see that the story can be given a introduction and through that, setup quite a few paths to explore.
Strategy
On the face of it strategy is the method through which we make decisions based on situational awareness, our instincts and other sources of acquired knowledge in order to achieve our goals. To me it represents the “game play”, but it goes beyond that. For example there are choices to make on what games to play and then also why to make specific moves in a game. With Wardely maps we mostly focus on business strategy and its associated decisions. It has proven to be valuable in that domain but more and more Wardley maps are applied at other domains as well. See for example the research Simon is doing. The thing to be aware of is that not every domain is as suitable, for example have a read of how well it fares in the (geo)political realm.
John Boyd and the OODA loop
A cornerstone of the process behind strategic decision making in Wardely mapping rests on the work done by US Air force Colonel John Boyd and his work on the OODA loop. Boyd, a military strategist, was able to capture the information types involved in the process of decision making in dynamic environments and the associated feedback loops. After years of refining the work on this it had been distilled into “Observe, Orient, Decide Act” (OODA). It’s fascinating to see how Boyd managed to capture so many sources of information in his research and distill them into superior air combat maneuvers through being agile. A remarkable insight.
Sun Tzu and the Art of war
Another remarkable person that has documented his insights into the way strategic outcomes are achieved is Sun Tzu, the Chinese General, military strategist, writer and philosopher. In his book “The Art of war” written around 2500 years ago(500 B.C.), he lays out Chinese strategic thinking culture. It is no coincidence that Boyd had his insights, since he borrowed a lot from the Chinese strategic thought to help define and influence Western strategic thinking. The wisdom contained in “The art of war” is hard to fathom for westerners since, they’re not acquainted with the traditional Chinese strategic thinking culture. To get a better insight read “How to read The Art Of War” by Derek M C Yuen. This book not just explains the original translations but puts the information in context to provide a better understanding.
“The Art of War” brings forward five elements that map onto the OODA loop very well, these are:
- Purpose
- Landscape
- Climate
- Doctrine
- Leadership
Purpose
We need to understand our own purpose and also the needs of our customers. This brings us the “why” of being in the game. There is also the purpose of movement, “why do this and not that”.
Landscape
Through strategy you want to maximize your advantaged and minimize the disadvantages. For that you’ll need situational awareness. Knowing the landscape you’re operating in is extremely valuable in that respect. It provides opportunities and can also indicate problematic areas.
Climate
Climate describes dynamic forces that are beyond our control, but when applied properly will help leverage advantage of the landscape we’re in and provide opportunity. Climate contains patterns that can be observed and applied. An example of a climatic pattern is: “Everything evolves”
Doctrine
This contains the body of knowledge we have that regardless of landscape and climate apply. In Wardley mapping this for example means “Focus on user needs”.
Leadership
This refers to the act of decision making, to lead and the options “how to lead” one has available to apply. In Wardely mapping this surfaces the question how to benefit from an investment. Do you invest in creating new value, improve speed, or improve efficiency?.
Two why’s
The why of purpose (“why are you in a game?) and the why of movement (why move here, not there?). This to a large extent influences the type of gameplay one chooses to fit the situation.
A note on the military aspect of strategy
It is when most is at stake that the quality of decision making counts the hardest. This is why in the military a lot of effort goes into making (or finding a way to make) the right strategic decisions. Over time the best ways of making decisions have evolved into our current best capability to do so. The military has invested a lot and by doing so has been able to refine the available knowledge into a science. Of course in business we may feel things are serious but it’s usually not that lives are directly at stake. Mistakes are howeer costly and can disrupt or bankrupt companies. This holds true when we talk about survival of companies and their struggles to survive in fierce competition or even suffering past (bad?) decisions. In those cases Wardley also refers to these organizations being in a state of war. So there is a certain relationship there with the military aspect.
What makes a map
Something that may seem obvious but really isn’t is the answer to the question “what makes a map?”. In Simon’s work he emphasizes in a very particular way “what constitutes a map”. It needs to:
- be visual
- Provide context
- Define position
- Define an anchor
- Depict movement
- Show components
If one of these characteristics is missing it’s not a map, but most likely a graph. Key to the given definition is that space has meaning! Simon has an effective demonstration of the “battle of Thermopylae”, also know from the story of “The 300”. This is a good visual reminder and sets up a the comparison with a SWOT analysis nicely.
What makes a Wardley map
Given the previous paragraph to state the ingredients of a map, let’s see how a Wardley map is defining these characteristics. 
- Obviously it’s visual.
- It provides context through a title and a set of axis that define the map
- It defines relative position of elements on the x- and y-axis
- It has an anchor, defined by the customer needs element
- It represents movement through evolutionary stages on the x-axis
- It shows the projected elements as individual components
Back to Boyd an Sun Tzu
A key aspect to making a strategic approach a success is iteration. Especially Boyd had emphasized that “the faster you can go through the loop, the bigger the advantage”. That still doesn’t imply every decision is the right one but we can use feedback and adaptability for that. So, the iterations are like the engine behind a developing strategy. In that cycle we use position and movement, climatic patterns and doctrine to help us understand the landscape and the state of a game we’re in. When we combine Boyd and Sun Tzu whe get “the strategy circle”, the basis for our iterations.
Strategy circle
One of the key insights Simon provides about the strategy circle is that it includes more types of information than Western Strategic thinking did before. The notions of landscape climate we’re not there which now allows for deeper insights since the two bring their own dynamic interplay into the game.
Climatic patterns
As the subject implies, patterns are repeated observations we can apply to understand movement within the system. It allows us to make limited predictions for the next iteration. Just the notion alone that “Everything evolves” gives reason to make maps and monitor how they evolve over time. There are a lot of climatic patterns, when learning about this limit yourself to just a few to help students understand where these belong.
Beware of the rabbit hole
As stated before, one should not try to become Simon when starting with mapping. Just simply the amount of knowledge he’s shared and has documented represents such a long journey and so many insights, all compiled into this big body of knowledge. Of course, once we get to understand more and more, these insights will actually benefit us. But for now we should start with just limited theoretical knowledge and start learning by doing. Along the way there’s plenty of opportunity to dive into the more specific things when iterating along the strategy circle and develop our maps.
First steps of mapping
For this I like the tea shop scenario. It’s relatively easy to understand such a business and people can also easily imagine components in the value chain or how to evolve into next steps. To get started just start with building a value chain, missing pieces are not to be worried about, no map is a perfect representation hence: “All models are wrong, some are useful”. Once you have a few pieces of the value chain, consider where they belong along the evolution axis and how visible they are. Then connect the components if they have dependencies. Refactor when you see room for improvement or clarification.
If possible, start with a small group of people
The way to learn about shared understanding is to develop this understanding together with others. The instant feedback and joined discovery is a great way to learn. Also it helps to build a more complete map initially and provide insights on potentially multiple approaches to move forward. Receiving feedback from multiple perspectives is invaluable to the quality of the documented situational awareness on the map.
Tooling
Personally I like to use VSCode to create a map. Have a look into my other post here to find out about tooling available to create maps.
Start with the user need
Not just part of the doctrine but also the starting point to reason about a value chain is to start with the user need. This need may be part of a larger value chain but its usually a good candidate to start the model. In this case we can define a Customer (anchor) that likes to get “a cup of tea”. Derive from there what is needed to deliver that “cup of tea” to represent the business of the tea shop.
Derive dependencies by uncovering deeper needs
For a “cup of tea” one needs hot water. That requires water and to make the water hot, it needs to be boiled, so a vessel to boil water. This discovery goes on and on until you end up with some components that are highly evolved (and thus provide less opportunity to be disrupted). Of course you can have a crack at that but try to keep things simple.
Now for the hot water it may have been easy, but the “cup of tea” is not yet complete. From a business perspective, it requires tea, maybe accompanied by biscuits and it needs to be served to a customer. That requires some form of order processing so in the end money can be exchanges for goods (and a sense of well being).
Models grow rapidly, so stay organized
Keep things organized in the VSCode .wm file when projecting the first components on a map. Through refactoring and keeping thing in check you’ll find its easier to maintain a map and make a next iteration or adjustments since you create predictability on where to find map items. I like to start with the title and anchors, then components (with their evolution or pipeline) and then relationships ending with flow’s annotations and map style and projection properties (evolution, y-axis, etc). Feel free to experiment with what suits your needs.
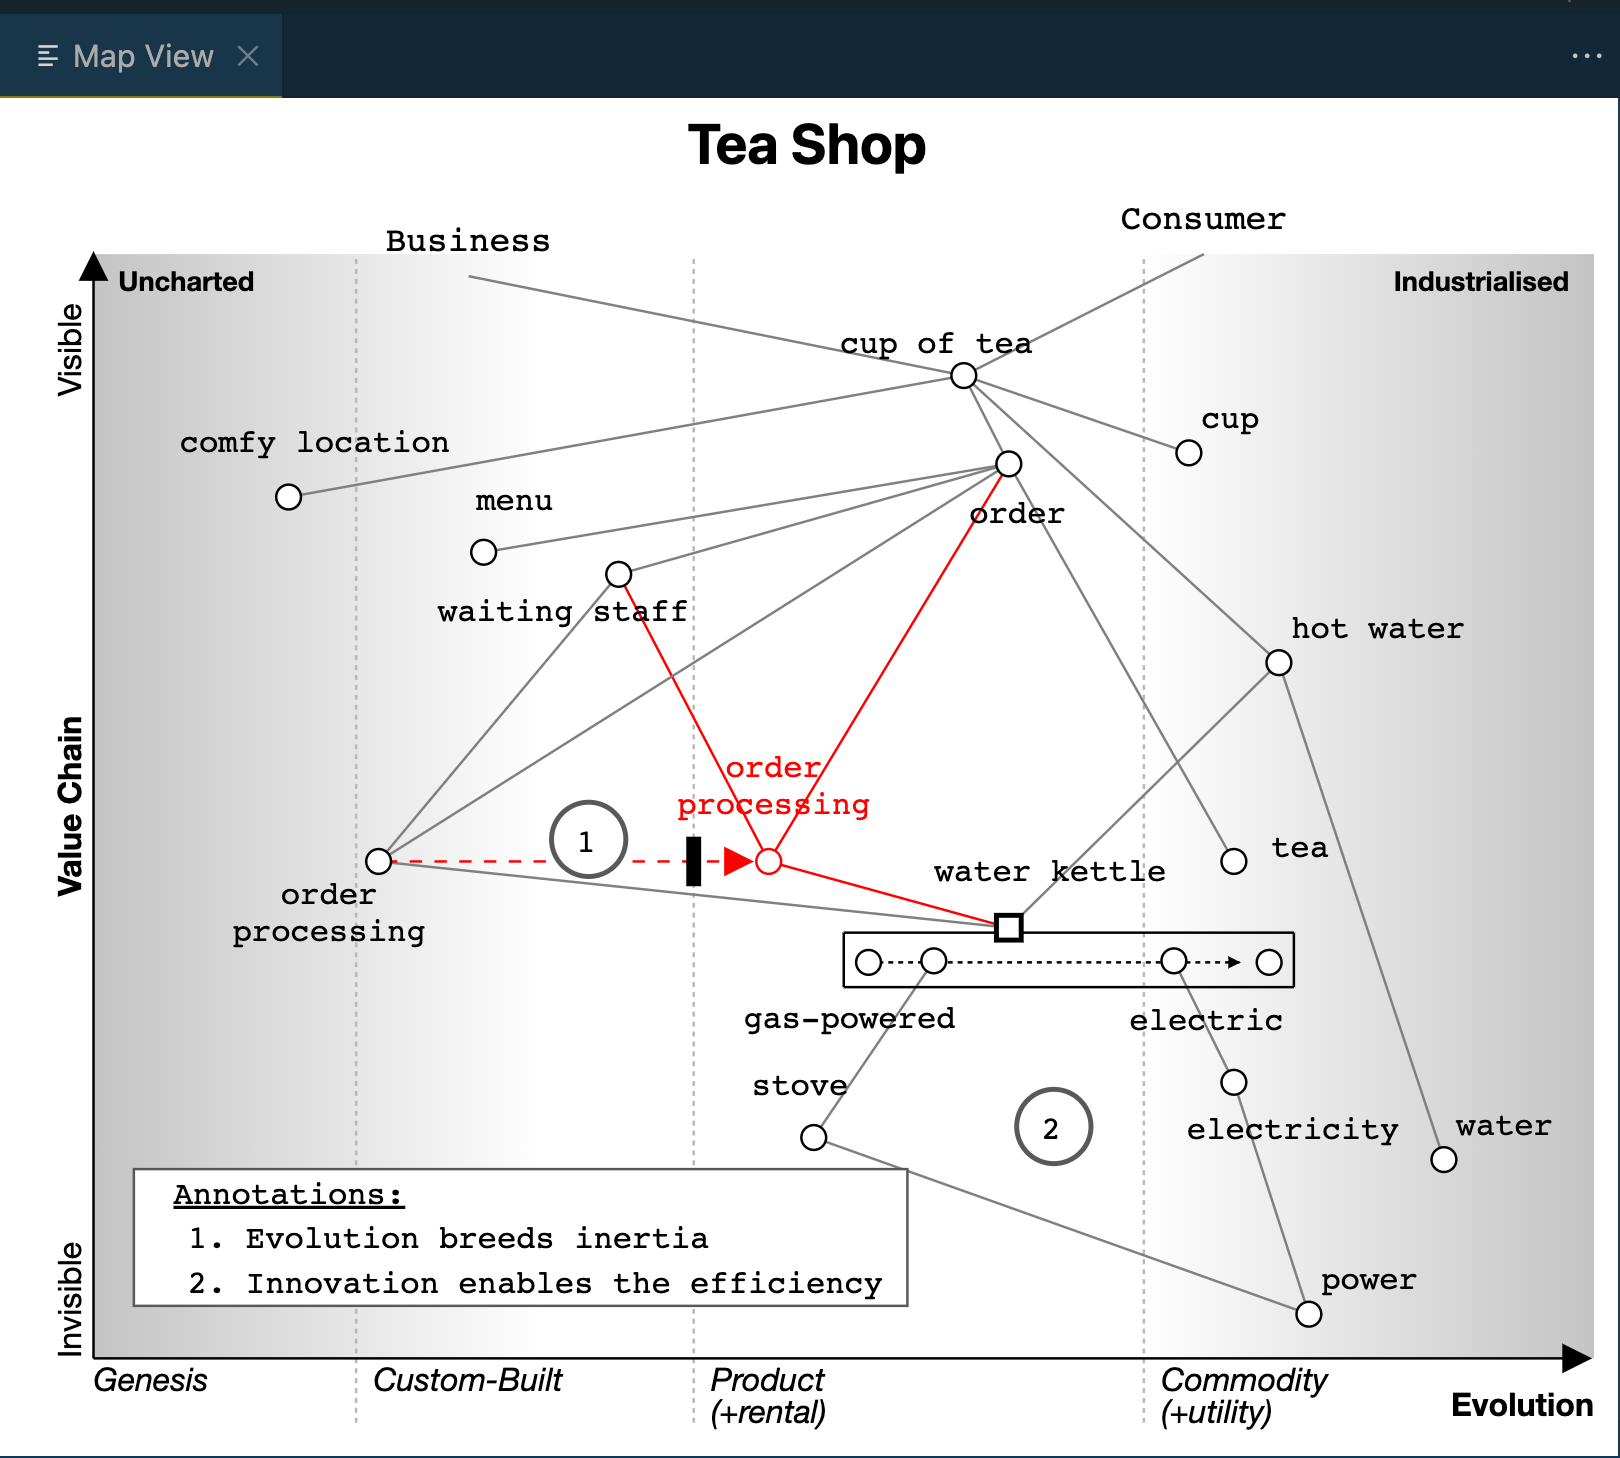
First results
After a few iterations and especially discovering multiple aspects to a tea shop I ended up with this model.
and this is the source:
title Tea Shop

anchor Business [0.98, 0.25]
anchor Consumer [1.00, 0.74]

component comfy location [0.78, 0.13] label [-44, -18]
component cup [0.82, 0.73]
component cup of tea [0.89, 0.58] label [-50, -9]
component electric [0.36, 0.72] label [-18, 28]
component electricity [0.25, 0.76] label [-19, 23]
component gas-powered [0.36, 0.56] label [-77, 27]
component hot water [0.63, 0.79] label [5, -10]
component menu [0.73, 0.26] label [-3, -17]
component order [0.81, 0.61] label [-16, 24]
component order processing [0.45, 0.19] label [-50, 7] inertia
evolve order processing 0.45 label [-28, -44]
component power [0.04, 0.81]
component stove [0.20, 0.48] label [-25, -17]
component tea [0.45, 0.76] label [15, -2]
component waiting staff [0.71, 0.35] label [-73, 19]
component water [0.18, 0.90] label [5, -10]
component water kettle [0.39, 0.61] label [-30, -19]
pipeline water kettle [0.50, 0.8]

Business -> cup of tea
Consumer -> cup of tea
cup of tea -> comfy location
cup of tea -> hot water
cup of tea -> cup
cup of tea -> order
electric -> electricity
electricity -> power
gas-powered -> stove
hot water -> water kettle
hot water->water
order -> menu
order -> waiting staff
order -> tea
order -> order processing
order processing-> water kettle
stove -> power
waiting staff-> order processing

annotation 1 [0.47,0.33] Evolution breeds inertia
annotation 2 [0.21, 0.64] Innovation enables the efficiency
annotations [0.14, 0.05]

style wardley
A lot more to explore
This has been the first introductory steps into making a Wardley map. There is so much more we can add but probably better to leave that for later times. For now I hope you’ve enjoyed taking these first steps and are inspired to look deeper into map making and applying the knowledge Simon has so carefully extracted. There is a world to learn!